Explore UAE Urban Spaces
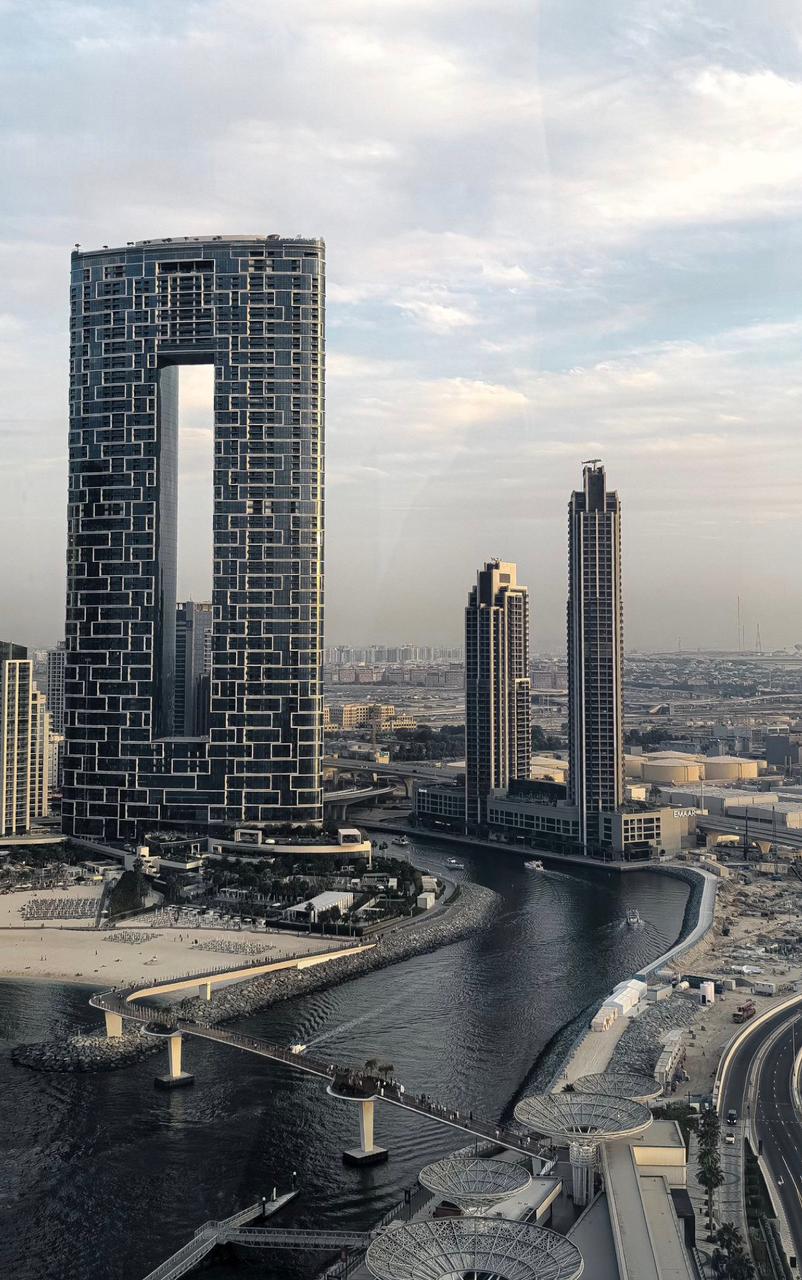
Space Analysis
Comprehensive analysis of urban zones, architectural objects, and public spaces in UAE cities.
Experience Mapping
Detailed mapping of art spaces, interactive installations, and cultural venues across Dubai and UAE.
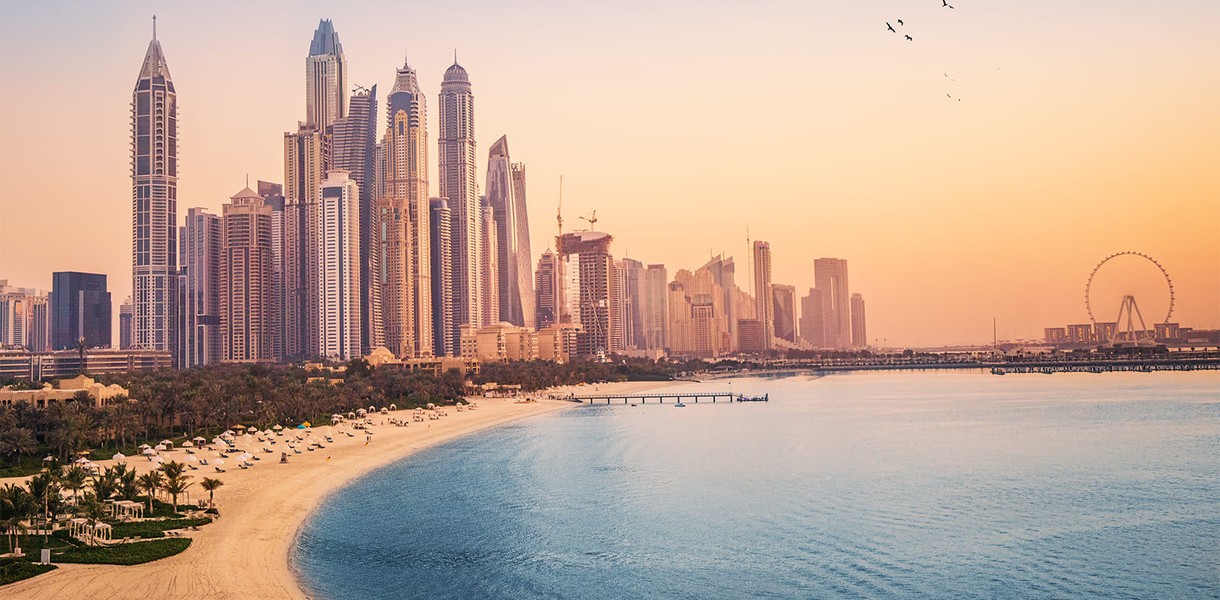
Leisure Analytics
In-depth study of water locations, aquaparks, waterparks, infinity pools, and entertainment programs.