Comprehensive analytical services for understanding UAE's urban spaces and experiences
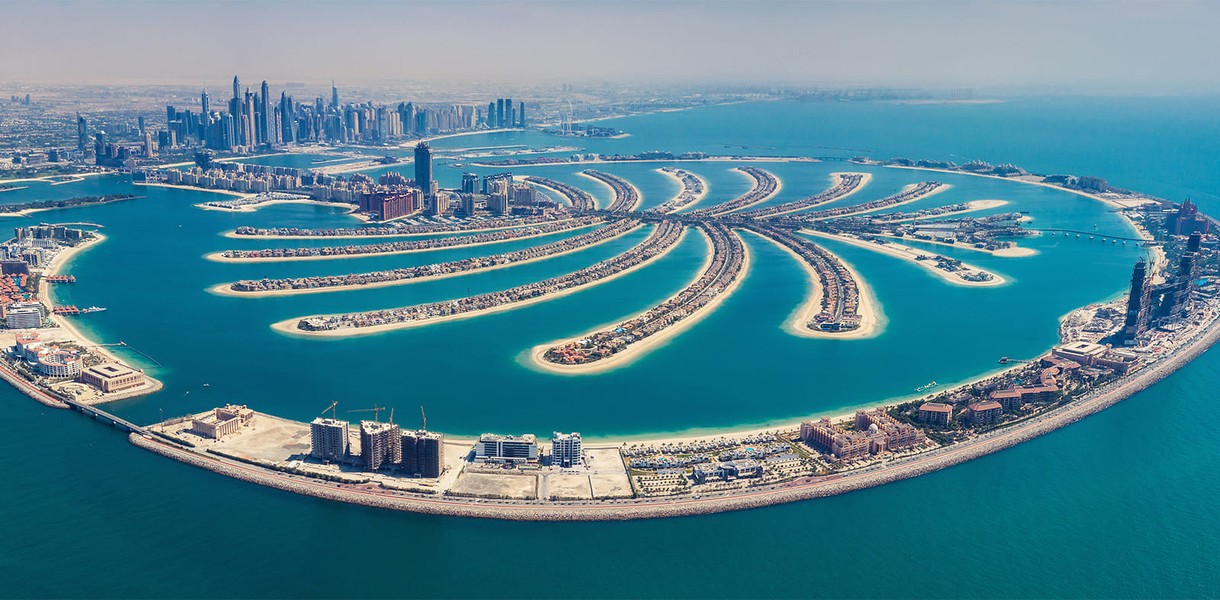
Comprehensive analysis of urban zones, architectural objects, and public spaces in UAE cities. We examine transformation patterns, usage trends, and visitor dynamics to understand how spaces evolve and function.
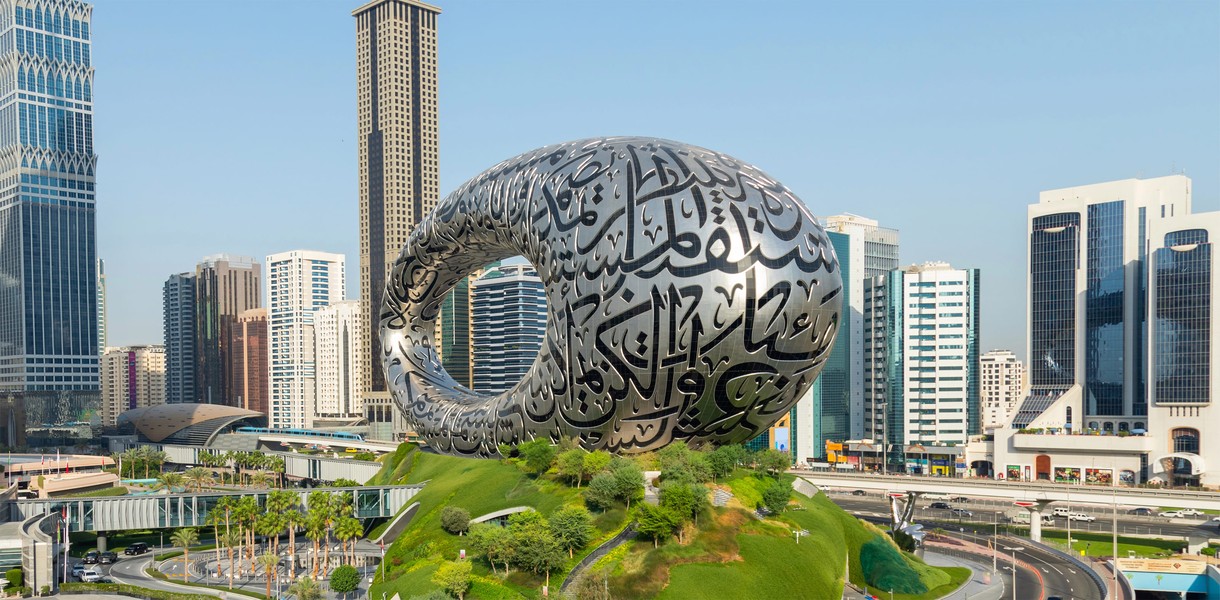
Our analysis covers architectural landmarks, public squares, commercial districts, and mixed-use developments across Dubai, Abu Dhabi, and other UAE cities.
Detailed mapping of art spaces, interactive installations, and cultural venues. Understanding visitor flows, engagement patterns, and experience quality to identify what makes spaces engaging and memorable.
We map cultural districts, art galleries, interactive installations, and creative spaces to understand their role in the urban experience.
In-depth study of water locations, aquaparks, waterparks, infinity pools, and entertainment programs. Analysis of attendance patterns, visitor preferences, and experience quality.
We analyze aquaparks, waterparks, infinity pools, beach clubs, and water-based entertainment venues to understand visitor behavior and preferences.
Personalized analytical guides based on your interests. We create comprehensive itineraries that combine different forms of recreation in harmony with the city's rhythm and your preferences.
Each guide is tailored to your specific interests, time constraints, and desired experiences, ensuring a harmonious combination of activities.
Analytical coverage of shows, concerts, events, and activities in UAE. Understanding event dynamics, audience engagement, and cultural impact to identify trends and patterns.
We track concerts, shows, festivals, cultural events, and entertainment activities to understand their role in the urban experience and visitor engagement.
Research into emerging trends in urban entertainment and leisure. Identifying new concepts, innovative spaces, and evolving visitor expectations to stay ahead of urban development.
Our research identifies emerging trends, innovative concepts, and evolving visitor expectations to help understand the future of urban experiences.
We gather comprehensive data through field research, visitor analytics, spatial analysis, and engagement metrics. Our data collection methods ensure accuracy and relevance.
Using advanced analytical methods, we process data to identify patterns, trends, and insights that help understand urban spaces and visitor experiences.
Based on analytical findings, we develop personalized guides that combine different forms of recreation in harmony with the city's rhythm and user preferences.
We continuously monitor and update our analysis to reflect changes in urban spaces, visitor patterns, and emerging trends.
Compare our analytical services to find the right solution for your needs
| Service Feature | Space Analysis | Experience Mapping | Leisure Analytics | Custom Guides |
|---|---|---|---|---|
| Data Collection | ✓ | ✓ | ✓ | ✓ |
| Visitor Pattern Analysis | ✓ | ✓ | ✓ | ✓ |
| Personalized Recommendations | — | — | — | ✓ |
| Trend Forecasting | — | ✓ | ✓ | ✓ |
| Water Activity Focus | — | — | ✓ | ✓ |
| Cultural Venue Analysis | ✓ | ✓ | — | ✓ |
| Event Tracking | — | ✓ | — | ✓ |
| Metric | Description | Frequency |
|---|---|---|
| Visitor Footfall | Daily and hourly visitor counts | Continuous |
| Space Utilization | Percentage of space actively used | Weekly |
| Dwell Time | Average time visitors spend in space | Daily |
| Peak Hours Analysis | Identification of busiest periods | Monthly |
Deliverable: Comprehensive space analysis report including utilization patterns, visitor demographics, and recommendations for optimization.
| Quality Indicator | Measurement Method | Target Score |
|---|---|---|
| Engagement Level | Visitor interaction time and depth | 4.5/5 |
| Satisfaction Rating | Post-visit surveys and reviews | 4.6/5 |
| Repeat Visit Rate | Percentage of returning visitors | 35%+ |
| Social Sharing | Social media mentions and shares | High |
Output: Detailed experience maps showing visitor flows, engagement hotspots, and recommendations for enhancing visitor experience.
| Activity Type | Peak Season | Peak Month | Average Capacity |
|---|---|---|---|
| Aquaparks | Summer (May-Sep) | July | 85% |
| Infinity Pools | Year-round | March | 75% |
| Beach Clubs | Winter (Nov-Mar) | January | 90% |
| Water Sports | Year-round | February | 60% |
Key Finding: Infinity pools maintain consistent popularity year-round, while aquaparks show strong seasonal variation with 90% capacity during summer months.
| Guide Category | Duration | Focus Areas | Popularity |
|---|---|---|---|
| Cultural Explorer | 3-5 days | Museums, galleries, heritage sites | High |
| Entertainment Seeker | 2-4 days | Theme parks, shows, concerts | Very High |
| Water Enthusiast | 3-7 days | Aquaparks, pools, beach activities | High |
| Mixed Experience | 5-7 days | Combination of all categories | Very High |
Process: Submit your preferences through our contact form, and our analytical team will create a customized guide within 48 hours.
Comprehensive analysis of Dubai Marina's public spaces revealed optimal visitor flow patterns and peak utilization times. Our study identified 12 key activity zones with distinct visitor characteristics.
Study of 60+ infinity pool locations across UAE hotels identified key factors influencing visitor satisfaction: location, design aesthetics, and complementary amenities show highest correlation with positive experiences.
Analysis of visitor engagement at museums and galleries shows 40% higher interaction during educational programs. Interactive installations demonstrate 2.5x longer dwell times compared to static displays.
Request a personalized analytical guide tailored to your interests and preferences.
Request Guide